
In this article, we will analyze HTTP Archive (HAR) files using Flask, a lightweight web framework for Python. HAR files are valuable for debugging web applications, as they contain a log of HTTP requests and responses made by a web browser. We will cover the installation process, code structure, and execution steps needed to get your HAR Analyzer up and running.
What is a HAR File?
A HAR file is a JSON-formatted archive file that records web browser interaction. It captures various information, including:
- Request and response headers
- Status codes
- Timings for different phases of requests (DNS resolution, connection, request sending, waiting for a response, and receiving data)
- Request and response bodies
This information is essential for developers and testers to troubleshoot performance issues, analyze API calls, and optimize web applications.
Project Overview
The HAR Analyzer provides a web interface where users can upload a HAR file for analysis. The application reads the HAR file, extracts relevant details, and displays them in a structured table.
- Summary of total requests, total time taken, success and failure counts
- Detailed view of each request, including response times, payloads, and error messages
- User-friendly design with responsive HTML/CSS
Installation and Setup
Prerequisites
Before you start, make sure you have the following installed on your machine:
- Python 3.x
- pip (Python package installer)
Step 1: Create a Virtual Environment
It’s good practice to use a virtual environment for Python projects to manage dependencies. Run the following commands in your terminal:
# Create a virtual environment
python -m venv har-analyzer-env

# Activate the virtual environment
# On Windows
har-analyzer-env\Scripts\activate
# On macOS/Linux
source har-analyzer-env/bin/activate
Step 2: Install Dependencies
Next, you need to install Flask and the haralyzer library. Run the following command:
pip install Flask haralyzer Step 3: Create the Project Structure
Create the following directory structure for your project:
har-analyzer/
│
├── templates/
│   ├── index.html
│   └── analyze.html
│
└── har_analyzer.py
Step 4: Add HTML Templates
Create two HTML files in the templates directory:
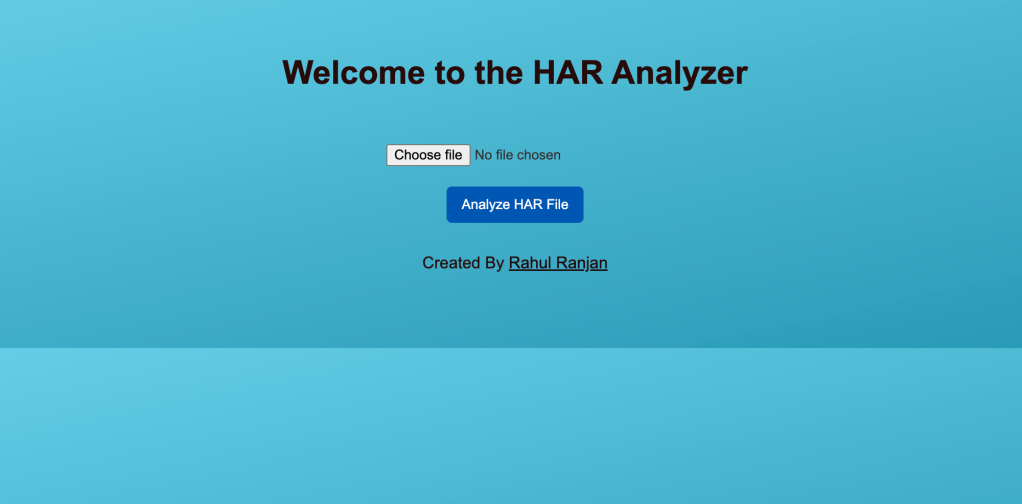
- index.html (for uploading HAR files)
<!DOCTYPE html>
<html lang="en">

<head>
    <meta charset="UTF-8">
    <meta name="viewport" content="width=device-width, initial-scale=1.0">
    <title>HAR Analyzer</title>
    <style>
        body {
            background: linear-gradient(to bottom right, #6dd5ed, #2193b0);
            /* Gradient background */
            font-family: Arial, sans-serif;
            color: #333;
            text-align: center;
            padding: 50px;
        }

        h1 {
            color: #280b0b;
            /* Header color */
        }

        form {
            margin-top: 20px;
            display: inline-block;
        }

        input[type="file"] {
            padding: 10px;
            border: none;
            border-radius: 5px;
            margin-bottom: 10px;
        }

        button {
            padding: 10px 15px;
            background-color: #0056b3;
            /* Button color */
            color: white;
            border: none;
            border-radius: 5px;
            cursor: pointer;
        }

        button:hover {
            background-color: #004494;
            /* Button hover color */
        }

        footer {
            margin-top: 30px;
            color: #280b0b;
            /* Footer text color */
        }
    </style>
</head>

<body>
    <h1>Welcome to the HAR Analyzer</h1>
    <form action="/analyze" method="POST" enctype="multipart/form-data">
        <input type="file" name="har_file" required>
        <br>
        <button type="submit">Analyze HAR File</button>
    </form>

    <footer>
        <p>Created By <a href="https://rahulranjan.org" style="color: rgb(30, 8, 8);">Rahul Ranjan</a></p>
    </footer>
</body>

</html>
2. analyze.html (for displaying results)
<!DOCTYPE html>
<html lang="en">

<head>
    <meta charset="UTF-8">
    <meta name="viewport" content="width=device-width, initial-scale=1.0">
    <title>HAR Analysis Results</title>
    <style>
        body {
            background: linear-gradient(to bottom right, #6dd5ed, #2193b0);
            /* Gradient background */
            font-family: Arial, sans-serif;
            color: #333;
            padding: 50px;
        }

        h1 {
            text-align: center;
            /* Center align the main title */
        }

        .summary {
            text-align: left;
            /* Left align the summary section */
            margin-top: 20px;
        }

        table {
            width: 100%;
            border-collapse: collapse;
            margin-top: 20px;
        }

        table,
        th,
        td {
            border: 1px solid black;
        }

        th,
        td {
            padding: 8px;
            text-align: left;
        }

        th {
            background-color: #f2f2f2;
        }

        footer {
            margin-top: 30px;
            color: #ffffff;
            /* Footer text color */
        }
    </style>
</head>

<body>
    <h1>HAR Analysis Results</h1>

    <div class="summary">
        <h2>Summary</h2>
        <p>Total Requests: {{ summary.total_requests }}</p>
        <p>Total Time: {{ summary.total_time }} ms</p>
        <p>Average Time: {{ summary.average_time }} ms</p>
        <p>Success Count: {{ summary.success_count }}</p>
        <p>Failure Count: {{ summary.failure_count }}</p>
    </div>

    <h3>Response Code Details</h3>
    <h4>1XX: Informational</h4>
    <p>Total 1XX Responses: {{ summary.status_code_counts[1] }}</p>

    <h4>2XX: Success</h4>
    <p>Total 2XX Responses: {{ summary.status_code_counts[2] }}</p>

    <h4>3XX: Redirection</h4>
    <p>Total 3XX Responses: {{ summary.status_code_counts[3] }}</p>

    <h4>4XX: Client Errors</h4>
    <p>Total 4XX Responses: {{ summary.status_code_counts[4] }}</p>

    <h4>5XX: Server Errors</h4>
    <p>Total 5XX Responses: {{ summary.status_code_counts[5] }}</p>

    <h2>Request Details</h2>
    <table>
        <thead>
            <tr>
                <th>Method</th>
                <th>URL</th>
                <th>Status</th>
                <th>Content-Type</th>
                <th>Time (ms)</th>
                <th>Source IP</th>
                <th>Response Size (KB)</th>
                <th>Latency (ms)</th> <!-- New Field for Latency -->
                <th>Time Breakdown</th>
                <th>Error Message</th>
                <th>Request Payload</th>
            </tr>
        </thead>
        <tbody>
            {% for entry in entries_data %}
            <tr>
                <td>{{ entry.method }}</td>
                <td>
                    <span title="{{ entry.url }}">{{ entry.url[:60] }}{% if entry.url|length > 60 %}...{% endif
                        %}</span>
                </td>
                <td>{{ entry.status }}</td>
                <td>{{ entry.content_type }}</td>
                <td>{{ entry.time }}</td>
                <td>{{ entry.source_ip }}</td>
                <td>{{ (entry.response_size / 1024) | round(2) }} KB</td> <!-- Convert size to KB -->
                <td>
                    {{ (entry.timings.dns + entry.timings.connect + entry.timings.send + entry.timings.wait +
                    entry.timings.receive) | round(2) }} ms
                </td> <!-- Calculate and display total latency -->
                <td>
                    DNS: {{ entry.timings.dns }} ms<br>
                    Connect: {{ entry.timings.connect }} ms<br>
                    Send: {{ entry.timings.send }} ms<br>
                    Wait: {{ entry.timings.wait }} ms<br>
                    Receive: {{ entry.timings.receive }} ms
                </td>
                <td>{{ entry.error_message if entry.error_message else 'N/A' }}</td>
                <td>{{ entry.payload }}</td>
            </tr>
            {% endfor %}
        </tbody>
    </table>

    <footer>
        <p>Created By <a href="https://rahulranjan.org" style="color: rgb(30, 8, 8);">Rahul Ranjan</a></p>
    </footer>

    <a href="/">Go back</a>
</body>

</html>
Step 5: Add Flask Application Code
Create a file named har_analyzer.py in the project root and add the following code:
from flask import Flask, render_template, request
import json
from haralyzer import HarParser

app = Flask(__name__)

# Function to parse HAR file and extract relevant data
def parse_har(file_path):
    with open(file_path, 'r') as f:
        har_data = json.load(f)

    parser = HarParser(har_data)
    entries_data = []
    total_time = 0
    status_code_counts = {1: 0, 2: 0, 3: 0, 4: 0, 5: 0}

    for entry in parser.har_data['entries']:
        request = entry['request']
        response = entry['response']
        timings = entry['timings']
        time_taken = timings['wait']  # You can adjust this to include other timings as needed

        # Status code category
        status_category = response['status'] // 100
        if status_category in status_code_counts:
            status_code_counts[status_category] += 1

        total_time += time_taken

        # Capture additional details
        entries_data.append({
            "method": request['method'],
            "url": request['url'],  # Full URL for tooltip
            "status": response['status'],
            "content_type": response['content'].get('mimeType', 'N/A'),
            "time": time_taken,  # Time in ms
            "source_ip": request.get('headers', [{}])[0].get('value', 'N/A'),  # Source IP assumed from headers
            "error_message": response.get('statusText') if response['status'] >= 400 else None,  # More robust error retrieval
            "payload": request.get('postData', {}).get('text', 'N/A'),  # Capture request payload if available
            "response_size": response.get('content', {}).get('size', 0),  # Response size in bytes
            "timings": {
                "dns": timings.get('dns', 'N/A'),
                "connect": timings.get('connect', 'N/A'),
                "send": timings.get('send', 'N/A'),
                "wait": timings.get('wait', 'N/A'),
                "receive": timings.get('receive', 'N/A'),
            }
        })

    summary = {
        "total_requests": len(entries_data),
        "total_time": total_time,
        "average_time": total_time / len(entries_data) if entries_data else 0,
        "status_code_counts": status_code_counts,
        "success_count": status_code_counts.get(2, 0),
        "failure_count": status_code_counts.get(4, 0) + status_code_counts.get(5, 0)
    }

    return entries_data, summary

# Route for HAR file analysis
@app.route('/', methods=['GET'])
def index():
    return render_template('index.html')

@app.route('/analyze', methods=['POST'])
def analyze_file():
    if 'har_file' not in request.files:
        return "No HAR file uploaded", 400

    har_file = request.files['har_file']
    file_path = "/tmp/harfile.har"
    har_file.save(file_path)

    entries_data, summary = parse_har(file_path)

    # Render results in a simple HTML table in the browser
    return render_template('analyze.html', summary=summary, entries_data=entries_data)

if __name__ == '__main__':
    app.run(debug=True)
Running the Application
Once you’ve set up everything, follow these steps to run the application:
- Ensure your virtual environment is activated.
- Run the Flask application:
python har_analyzer.py3. Access the application: Open your web browser and navigate to http://127.0.0.1:5000/. You should see the HAR Analyzer interface.
4. Upload a HAR file: Click the “Choose File” button to select a HAR file from your system, then click the “Analyze HAR File” button. The application will process the file and display the analysis results.


Output Details
The application will provide a detailed table with various metrics, including:
- HTTP Method
- URL
- Response Status
- Content Type
- Time Taken
- Source IP
- Response Size
- Latency
- Breakdown of DNS, Connect, Send, and Receive times
- Error Messages, if any
- Request Payload
Conclusion
In this article, we have created a simple HAR file analyzer using Flask, enabling users to upload and analyze HAR files easily. This project not only teaches how to work with Flask but also highlights the practical usefulness of HAR files in web development.
I will add additional features and visualizations to enhance the project. The code will be uploaded to my GitHub.
Reach out at Linkedin for any questions.
#Docker #HAR #Troubleshooting #UI #Flask


Leave a comment