
Weather data is crucial for businesses, travel, agriculture, and daily life. In this article, we will build a real-time weather dashboard using Python, Elasticsearch, and Docker. We’ll fetch live weather data using the WeatherAPI and make it available for analysis through Kibana.
This article demonstrates how to:
- Fetch live weather data for multiple cities.
- Store the data in Elasticsearch.
- Containerize the application using Docker.
- Automate data ingestion for scalability.
- Create Kibana visualizations and dashboards to analyze the data.
Step 1: Setting Up the Environment
We’ll use Docker to create a containerized environment for the project, ensuring compatibility across systems.
Create Project Directory
mkdir Weather_Dashboard
cd Weather_Dashboard
Add Requirements
Create a requirements.txt file with the necessary dependencies:
requests
elasticsearch
schedule
Write a Dockerfile
The Dockerfile defines how to build the application image:
# Use Python slim image
FROM python:3.9-slim

# Set working directory
WORKDIR /app

# Copy dependencies
COPY requirements.txt ./
RUN pip install --no-cache-dir -r requirements.txt

# Copy application files
COPY . .

# Default command
CMD ["python", "weather_ingest.py"]
This ensures Python and dependencies are installed inside the container.
Step 2: Get Your WeatherAPI Key
We will use WeatherAPI to fetch weather data. Follow these steps to get your API key:
- Go to WeatherAPI.com and click on Sign Up.
- Create an account by providing your email and password.
- Once registered, log in to your dashboard.
- Navigate to the API Keys section.
- Click on Generate Key and copy the API key provided.
Validate the WeatherAPI Key
curl "http://api.weatherapi.com/v1/current.json?key=<replace your key>&q=London&aqi=no"We’ll use this key in the environment variables for our project.
Step 3: Writing the Python Script
Next, we create the Python script, weather_ingest.py which fetches weather data and stores it in Elasticsearch.
import requests
from elasticsearch import Elasticsearch
import schedule
import time
import datetime
import os

# Elasticsearch configuration
ES_HOST = os.getenv("ES_HOST", "replace with your elasticsearch end point")
ES_USERNAME = os.getenv("ES_USERNAME", "<replace your username>")
ES_PASSWORD = os.getenv("ES_PASSWORD", "<replace your password?")
ES_INDEX = "weather-data"

# Weather API configuration
API_KEY = os.getenv("API_KEY", "<replace your api key")
CITIES = ["London", "Bangalore", "New York"] #Replace with city name you want to monitor

# Connect to Elasticsearch
es = Elasticsearch(
    ES_HOST,
    basic_auth=(ES_USERNAME, ES_PASSWORD)
)

# Create index if it doesn't exist
if not es.indices.exists(index=ES_INDEX):
    es.indices.create(index=ES_INDEX)

# Function to fetch and store weather data
def fetch_weather_data():
    for city in CITIES:
        try:
            # API call
            api_url = f"http://api.weatherapi.com/v1/current.json?key={API_KEY}&q={city}&aqi=no"
            response = requests.get(api_url)
            data = response.json()

            # Prepare document
            weather_doc = {
                "city": city,
                "temperature": data["current"]["temp_c"],
                "humidity": data["current"]["humidity"],
                "pressure": data["current"]["pressure_mb"],
                "weather": data["current"]["condition"]["text"],
                "wind_speed": data["current"]["wind_kph"],
                "timestamp": datetime.datetime.utcnow()
            }

            # Index data
            es.index(index=ES_INDEX, document=weather_doc)
            print(f"Weather data for {city} ingested successfully:", weather_doc)
        except Exception as e:
            print(f"Error fetching or indexing data for {city}: {e}")

# Schedule the job every 10 minutes
schedule.every(10).minutes.do(fetch_weather_data)

# Start the scheduler
if __name__ == "__main__":
    fetch_weather_data()
    while True:
        schedule.run_pending()
        time.sleep(1)
This script runs continuously, fetching and storing weather data at 10-minute intervals.
Step 4: Setting Up Docker Compose
Docker Compose simplifies running multi-container setups.
docker-compose.yml
version: '3.8'

services:
  weather-ingest:
    build: .
    environment:
      - ES_HOST=<replace with your elasticsearch end point>
      - ES_USERNAME=<replace with your username>
      - ES_PASSWORD=<replace with your password>
      - API_KEY=<replace with weatherapi key>
    restart: always
This file defines environment variables and ensures the service restarts if it fails.
Step 5: Running the Project
Build and Start Containers
# Build the Docker image
docker-compose build

# Start the container
docker-compose up -d
Monitor Logs
docker-compose logs -fYou should see logs indicating successful ingestion of weather data.
Step 6: Verifying Data in Elasticsearch
Once the data is ingested, verify it through Elastic search’s API:
curl -u username:password <endpoint url>/weather-data/_search?pretty=trueYou can also visualize the data in Kibana by connecting it to Elasticsearch.
Step 7: Creating Visualizations and Dashboards in Kibana
- Access Kibana:
- Go to your Elasticsearch Cloud instance.
- Open the Kibana interface.
2. Connect to Index:
- Navigate to Stack Management > Index Patterns.
- Click Create Index Pattern.
- Enter “weather-data” as the index name.
- Select timestamp as the time filter field.
3. Create Visualizations:
- Go to Visualize Library.
- Click Create Visualization.
- Choose visualization types like Bar Chart, Line Chart, and Maps.
For example:
- Temperature Trends: Use a Line Chart to plot temperature against time.
- City-wise Comparison: Use a Bar Chart to compare metrics across cities.
- Wind Speed Map: Create a geographical map showing wind speeds.
4. Build Dashboard:
- Go to Dashboard and click Create New Dashboard.
- Add visualizations to create a comprehensive view.
- Save the dashboard.


5. Monitor in Real Time:
- Use filters and time ranges to analyze trends in real time.
Additional Visualizations
- Heatmap for Temperature Distribution:
- Go to Visualize Library.
- Select Heatmap.
- X-axis: City.
- Y-axis: Temperature ranges (use histogram aggregation).
- Add color intensity based on temperature.
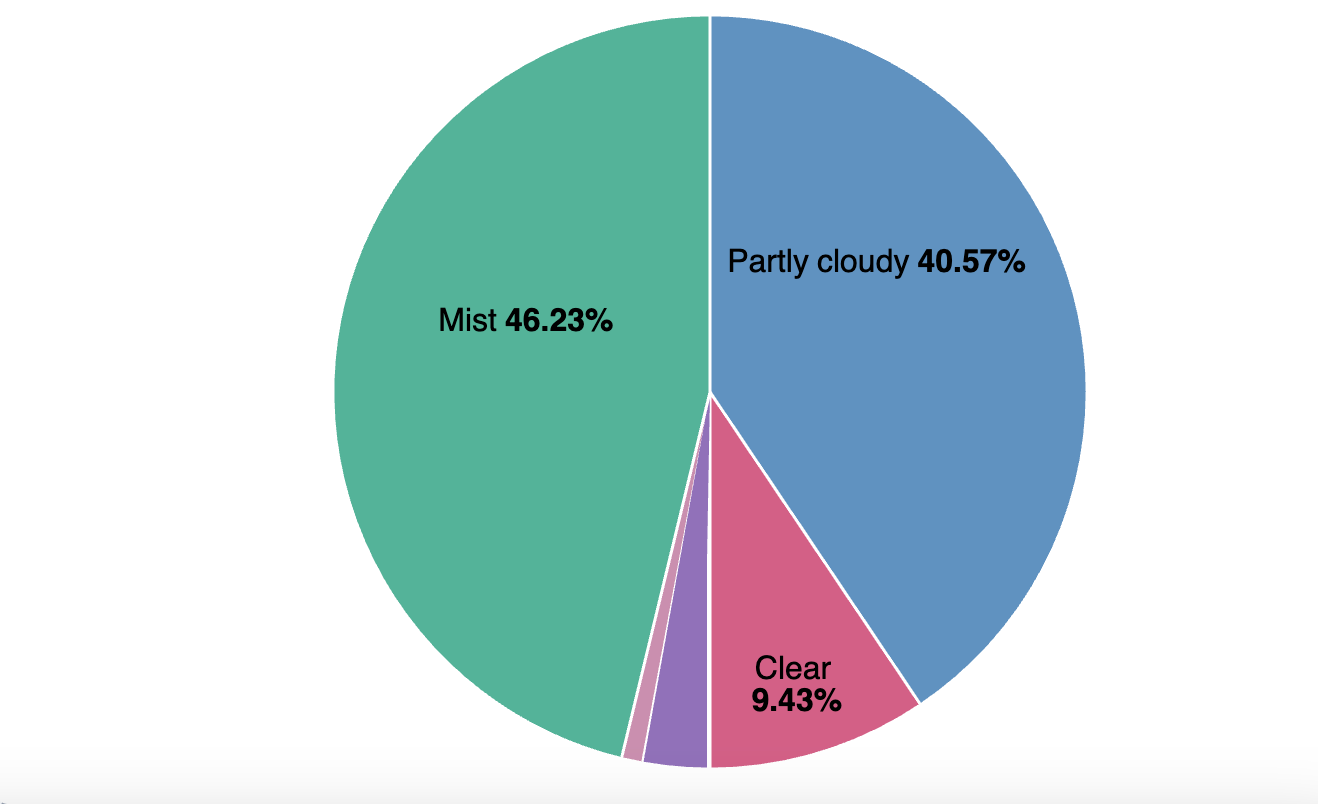
2. Pie Chart for Weather Conditions:
- Select Pie Chart.
- Bucket: Terms aggregation based on the “weather” field.
- Slice size: Count.
3. Data Table for Wind Speed Rankings:
- Choose Data Table.
- Rows: City.
- Metrics: Max Wind Speed.
4. Area Chart for Humidity Trends:
- Create an Area Chart.
- X-axis: Timestamp.
- Y-axis: Average Humidity.
- Split series by City.
Step 7: Scaling the Application
This containerized setup can be deployed on cloud platforms like AWS or Azure for scalability. Adding new cities is as simple as updating the CITIES list in the script.
CITIES = ["London", "Bangalore", "New York", "New Delhi", "Pune", "Chennai", "Mumbai"]Conclusion
This project demonstrates how to build a scalable, real-time weather dashboard using modern tools like Docker, Elasticsearch, and Python. By containerizing the application, we ensure it runs consistently across environments, making it production-ready.
The project code is available at my Github Repo.
Related Article:
OpenTelemetry with Elastic Observability
Elastic RUM (Real User Monitoring) with Open Telemetry (OTel).
OpenTelemetry: Automatic vs. Manual Instrumentation — Which One Should You Use?
Configuration of the Elastic Distribution of OpenTelemetry Collector (EDOT)
Test and Analyze OpenTelemetry Collector processing
#otel #docker #kubernetes #devops #elasticsearch #observability #search #apm #APM #python #kibana #dashboard
Reach out at Linkedin for any questions.


Leave a comment