

Today, in cloud-native applications, monitoring and observing services effectively to ensure high availability and performance is essential. One crucial aspect of this is distributed tracing, which helps us understand how requests move through complex systems. This article will teach us how to set up OpenTelemetry in a Java application to improve observability. The guide will take us through the steps, from environment setup to deploying the application in a Dockerized environment, and then visualize the data in the Elastic Observability App.
1. Project Overview
This project aimed to implement OpenTelemetry in an existing Java application to monitor and trace API calls and transactions. The application simulates HTTP API calls and is created and executed using Maven and Docker. The tracing data is exported to an OpenTelemetry Collector, which then processes it and sends it to a chosen back-end for visualization and analysis. In this case, we used Elastic Observability.
2. Setting Up the Java Application
We started by preparing the Java application. The application was a simple HTTP server that listened on port 8001 and simulated various API calls. Here’s a high-level overview of the steps:
- Create Java Application: We created a basic Java application (
TestHttpServer.java) that acts as an HTTP server. - Configure Maven: We used Maven to manage the dependencies and build the project. The
pom.xmlfile was set up to include necessary libraries. - Build the Application: The application was built using Maven, and the generated JAR file was used in the Docker setup.
3. Introducing OpenTelemetry
The next step was to integrate OpenTelemetry into the Java application. OpenTelemetry is an open-source observability framework that provides APIs, libraries, agents, and instrumentation to enable observability in your services.
- Download OpenTelemetry Java Agent: The OpenTelemetry Java agent was downloaded and included in the application’s Docker image.
- Configure OpenTelemetry: The application was configured to use the OpenTelemetry Java agent by specifying JVM parameters during the application startup. The OpenTelemetry agent was configured to send traces to the OpenTelemetry Collector using the OTLP protocol.
4. Dockerizing the Application
To ensure the application is portable and easy to deploy, we containerized it using Docker.
Simplified version of the Dockerfile:
# Stage 1: Build the Java application
FROM maven:3.8.5-openjdk-11 AS build
WORKDIR /app
COPY TestHttpServer.java src/main/java/
COPY log4j2.xml src/main/resources/
COPY pom.xml .
RUN mvn clean package -DskipTests

# Stage 2: Run the Java application
FROM openjdk:11-jre-slim
WORKDIR /usr/src/myapp
COPY --from=build /app/target/rranjan-java-app-1.0-SNAPSHOT.jar rranjan-java-app.jar
RUN wget https://github.com/open-telemetry/opentelemetry-java-instrumentation/releases/download/v1.27.0/opentelemetry-javaagent.jar -O /usr/src/myapp/opentelemetry-javaagent.jar
EXPOSE 8001
CMD ["java", \
    "-javaagent:/usr/src/myapp/opentelemetry-javaagent.jar", \
    "-Dotel.exporter.otlp.endpoint=http://otel-collector:4317", \
    "-Dotel.service.name=rranjan-java-app", \
    "-Dotel.resource.attributes=deployment.environment=dev", \
    "-jar", "rranjan-java-app.jar"]
5. Setting Up OpenTelemetry Collector
To collect, process, and export the tracing data, we deployed an OpenTelemetry Collector. This collector was configured to receive traces from the Java application and send them to the desired backend.
- Run OpenTelemetry Collector: The collector was run as a Docker container in the same network as the Java application, listening on port 4317 for OTLP data.
6. Deploying the Application
The application, in conjunction with the OpenTelemetry Collector, was deployed using Docker Compose to orchestrate the multi-container setup.
- Create Docker Compose File: we created a
docker-compose.ymlfile to define the services, including the Java application and the OpenTelemetry Collector. - Deploy the Containers: The containers were deployed using
docker-compose
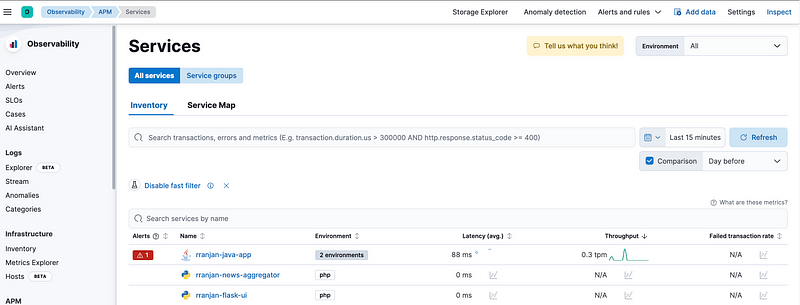
8. Visualize the openTelemetry collected data in the Elastic Observability App in Kibana.
With everything set up, the OpenTelemetry Collector began receiving and exporting traces from the Java application. These traces provided detailed insights into the application’s performance, helping to identify bottlenecks and optimize the system.


7. Troubleshooting
Review the application and collector logs for any issues.
9. We can enable Real User Monitoring (RUM) on the UI page to collect User-agent data and visualize in ElasticDashbaord referring Elastic RUM (Real User Monitoring) with Open Telemetry (OTel).
Related Articles:
OpenTelemetry with Elastic Observability
Elastic RUM (Real User Monitoring) with Open Telemetry (OTel).
OpenTelemetry: Automatic vs. Manual Instrumentation — Which One Should You Use?
Test and Analyze OpenTelemetry Collector processing
Configuration of the Elastic Distribution of OpenTelemetry Collector (EDOT)
Linkedin: https://www.linkedin.com/in/rahul-ranjan-b86b7315/
#Docker #Linux #Kubernetes #Devops #Elasticsearch #Kibana #Otel #OpenTelemetry #APM #Observability #Java #Application #ELK


Leave a comment